Author Archives: skorasaurus

Hi, I’m Will.

New home of the blog

I’ve forgotten to mention that I’ve been posting on a new version of this blog at https://skorasaur.us

The new home, powered by the Jekyll, allows me to embed web maps in posts, pages and other customizations.

I’ll migrate the content on here over there one day.

Introducing Marillac – A way to find food pantries in Cuyahoga County

As a food pantry manager, I occasionally get asked: where else can I get food?

Conversations would go like this:

If they asked in person,

I or a pantry volunteer would hand them a paper list (that they couldn’t take to keep) that were sorted by zip code with listings that contained the name of the organization, the address, zip, type of assistance they gave (a hot meal or a pantry where people can receive parishable and non-parishable groceries), and if there were any geographic restriction (1).

If I was helping a client on the telephone,

I would type their address into google maps, get their zip code, and try to figure out which locations sounded they would be close to them. Look at a private web page hosted by the Greater Cleveland Food Bank that lists agencies sorted by zip code, name some of the locations, ask if they sound close or familiar to the client and then give them the information.

There had to be a better way to getting this information to people. Drawing from my experience of a year of managing a pantry and my mapping background,
I’m making a map/web app that allows other pantry managers who are asked this question to answer this question more informatively and quicker by making Marillac, a web map that has allow the user to:

– input the person’s address
– the map will automatically zoom to the address on the map and display pantries and hot meals near the person’s home;
– find additional details about the pantry/hot meal by clicking on the icon;

Use it at: http://skorasaurus.github.io/marillac/

This is the first usable version and I’m sharing it with fellow agencies and the local food bank (the Greater Cleveland Food Bank) to see if they find it useful and what can be done to make it more useful for my fellow pantry managers. I used it for the first time earlier this week with a person who called me and it worked :)

If you’re interested in seeing the source code, you can view it on https://github.com/skorasaurus/marillac
(If you’re javascript proficient, any tips or suggestions on my code too would be appreciated!)

Technical details (for the opendata geeks and the curious):
As I dove into this, there was a lot of work to be done; my data sources were a PDF and
or a web page (only available to agencies) that organized the locations by zip. I first scraped the PDF using Tabula, did some formatting with regex, and turned it into a csv file and then a geojson file (mapbox’s csv2geojson). Then, I needed to find a geocoder for addresses that are inputted. I finally found one: SmartyStreets, with a great price (free!) for non-profits.
I’m a big fan and user of mapbox; so I used mapbox’s mapping library. I was still a little rusty on some of my javascript, so some mapbox’s excellent examples for mapbox.js, like filtering markers, were also useful.

(1) Most pantries restrict access based on a person’s zip code although they will usually serve a person for the first time. Zip codes aren’t always an effective way geographic boundary. What may be close for one resident in a zip isn’t close at all. (See this gis.stackexchange discussion for a more technical explanation)

How I styled polygons in mapbox.js from an external geojson file

so, this blog post had come a lot later than I expected
because a bit of yak shaving and I explain why at the end of this post.
This post is also the followup to How I learned a 3rd way to link external GEOJSON files in mapbox.js and leaflet.

How to style polygons, based on their properties, that were stored in an external geojson file, using mapbox.js

The Code referenced in this post is based on this commit and is viewable here .

To see the most updated of the Downtown Cleveland public parking map, which may include changes that were made after this blog post, go to http://skorasaurus.github.io/dtparking/

I’ll go through a couple things of what the code is doing and hopefully clarify a couple things for you:

First, at Line 52, I create a featureLayer method that will be used to
load the geojson file
.

Then, load your geojson file using loadURL() . In this example, it’s in the same directory as the index.html file.

Line 63 is a function will return the color based on the argument of the function. myargument is just a placeholder of sorts. This function is later called on lines 82 and 83 with to read the value of parking, which describes what kind of parking lot it is – surface, a multi-storey, or a underground one (written as polygon.feature.properties.parking)

Why polygon is there, I honestly can’t explain at the moment.
feature is there to represent each feature in our featLayer. I did not name it feature, but
properties is there to reference the properties of each feature,
and parking is to select the parking property.

There’s likely many different ways to write this function that begins at line 63 but this one that works for me. I’m interested to hear if there’s any disadvantages to what I did here.

The eachLayer method is confusing. This method is being used to say “hey, I want this code (in lines 77-83) to act on every object (all of the parking areas) that’s in featLayer. Layers have different meanings depending on context in geospatial/GIS.

Line 82
getMyColor is just an arbitrary name that I made to name the function that I made.I still catch myself once in a while of what is function and what is a method….
In several past commits, I didn’t include the ‘feature’ part of the object
because I had mistaken assumed that eachLayer method would go through each object within the layer and that adding ‘feature’ wasn’t necessary.

Beginning at line 63, is the function that will return a different color depending on what is the value of parking. For example, for this polygon parking has a value of ‘surface’ so ‘#679967’ is used as the fillColor for that particular polygon.

polygon and myargument are both arbitrary names that are selected by the coder. If you were to copy and paste this page into as your own, (as well as the dtparking.geojson file at the github repo ), you could rename polygon to
blob and myargument to judgejudy in each place and it’ll work.

Some helpful reminders/refreshers:

‘what’s a method versus a function?’ (unfortunately, I couldn’t find a nice, succinct answer for people on the web);
eachLayer (and all of the functions within mapbox.js, actually) is asynchronous – if you don’t know what this means, it can be explained better than I can by Michael Vollmer here

All methods in mapbox.js will begin with “l.mapbox.” ; you can still use leaflet methods which begin with “l.”

Interestingly, l.geojson is NOT asynchronous, I understand this better after this project. (I don’t know if there’s a way to determine if a class or its methods are asynchronous or not).

Mozilla’s javascript guide and reference are great.

=====

Cause for the delay of posting this blog post; one of my features in the geojson file was missing the parking property and caused the following error in the javascript console for the dtparking html page even though the html code was otherwise working. I added it to here in case someone else would have the same problem and search for the solution.

it was returning the following in the console:

Uncaught TypeError: undefined is not a function 945fae4e059fb12090a8dc22c6cd22e665ebeea2.html:51
(anonymous function) 945fae4e059fb12090a8dc22c6cd22e665ebeea2.html:51
s.LayerGroup.s.Class.extend.eachLayer mapbox.js:2
(anonymous function) 945fae4e059fb12090a8dc22c6cd22e665ebeea2.html:50
s.Mixin.Events.fireEvent mapbox.js:1
(anonymous function) mapbox.js:6
(anonymous function) mapbox.js:1
a mapbox.js:6

I fixed it in
this commit

Updating an alias to update a developmental install of mapbox-studio

(this assumes that you’re comfortable with some knowledge of github, git, and using linux).

I’ve been using mapbox’s mapbox-studio (previously known as tm2) and while it was going rapid development, I was tired of doing updating it (by using git ) nd reinstalling it, so
I made a bash alias (alias is a shortcut that you make in linux for your command line) to pull updates from mapbox’s mapbox-studio to my local fork, delete the node_modules as mapbox suggests, pull the newest changes from mapbox (upstream) on github, then reinstall mapbox-studio through npm.

here’s the alias, 3 commands that are instructed to run after the first one is completed:

alias udtm2='cd ~/prg/tm2/ rm -rf ~/prg/tm2/node_modules && git pull upstream mb-pages && npm install'

(by using the && after a command, the second following command won’t run until the first is completed! neato trick!)

Within the past couple weeks, mapbox renamed the repository from tm2 to mapbox-studio and they also switched the default branch from master to mb-pages.

So, when I ran my bash alias this morning: I received this error:

fatal: Couldn’t find remote ref master

So, I fixed my bash alias by doing 2 things:

1] First, I went into the .git folder within my local repo,

Edited the text that said and replaced master with mb-pages in both places.
[branch “master”]
remote = origin
merge = refs/heads/master

2] Updated my alias.

You can simply update an alias by
alias udtm2=’rm -rf ~/prg/tm2/node_modules && git pull upstream mb-pages && npm install’

Now, I can update my mapbox-studio by a simple command, udtm2 :)

How I learned a 3rd way to link external GEOJSON files in mapbox.js and leaflet.

How I learned a 3rd way to link to External GEOJSON files in mapbox.js and leaflet.

Do you have a geojson file and want to load it up in leaflet?

All it takes are two lines.

var featLayer = L.mapbox.featureLayer().addTo(mizzap);
featLayer.loadURL('dtparking.geojson');

The first line initializes the feature layer to your map.
In my example, mizzap is the variable of the object that I created to initialize my map.. (I hate that ‘map’ is used all the time as a variable), you don’t know what’s it is referring to). Mizzap can be refer to an object directed through l.mapbox.map or l.map :)

The second line loads my geojson file which is in the same directory as my html file. I can now use it later on simply as ‘featLayer’.
.

For context, here is the finished product as html .

I loosely called it ‘the 3rd way’ as fellow Maptime organizer and all-around kickass person Lyzi Diamond described 2 other ways ( (1) and (2) ) ways to load Geojson files and I aspire that this post compliments her posts..

Why did I use this way to load my geojson (And you can too)?

Now, how I learned to use this 3rd way was because I wanted to load and style polygons in leaflet or mapbox.js based on properties within the geojson file AND I didn’t want to include styling properties in the geojson file.

Also, I’m still learning javascript and I was quite admittedly a little frustrated (and surprised) to find plenty of examples online of loading geojson and styling it but none of them fit my use case.

There were numerous examples of how to load and customize points…
https://github.com/maptime/maptime-bites/blob/gh-pages/00004/index.html
https://www.mapbox.com/mapbox.js/example/v1.0.0/markers-from-csv-custom-style/
https://www.mapbox.com/foundations/building-a-store-locator/
https://www.mapbox.com/mapbox.js/example/v1.0.0/markers-as-links/
http://bl.ocks.org/geografa/8743008
http://ebrelsford.github.io/jekyll-map/
http://lyzidiamond.com/posts/osgeo-august-meeting/

or

They were loading GEOJSON within the browser itself and not to an external file.
https://www.mapbox.com/mapbox.js/example/v1.0.0/geojson-simplestyle/

or
referring to a GEOJSON File (example) which isn’t a true geojson file, but has its variable in it, as mapbox did in this choropleth example.
This last point is problematic if you’re sharing this data set as Lyzi Diamond concisely explains:

If you tried to show the file in GitHub, for example, the points would not be interpreted and a map would not be rendered. Additionally, you don’t always have direct control over the GeoJSON file itself, especially if it’s a shared dataset or if it’s being returned from some other process. Adding a variable definition could also potentially mess up the work of anyone else trying to use your dataset, if it is indeed a dataset you constructed.

OR in some instances, the authors did a combination of these.

I admit, I wasn’t familiar with AJAX at all and didn’t want to touch it. Looking back, I was probably too intimidated by it and at the same time I was reading the mapbox.js documentation and thought: ‘wow, using Mapbox.js will save me some time and not have to use the Leaflet-Ajax plugin ,
I had used mapbox.js a couple times before and knew it includes the functionality of leaflet, also has many other methods and classes that are designed to add more functionality, and offers easier integration with map tiles from mapbox.com

I told myself:”I could just load my geojson file using loadurl(), and mapbox will have an example to show me!”

I learn code by reading examples and modifying them.

Below, I go through several commits where I learned to use loadURL(), load and style all polygons in a geojson file, and then point out my mistakes along the way where I used the wrong code.
=======
Commit one:

I tried to use the style option (from l.geojson) and a switch to customize the styling of the geojson file as on show on leaflet’s geojson example page .
which has the follow example.
===
L.geoJson(states, {
style: function(feature) {
switch (feature.properties.party) {
case ‘Republican’: return {color: “#ff0000”};
case ‘Democrat’: return {color: “#0000ff”};
}
}
}).addTo(map);

I adapted it in this commit (on github) and as html here
Unfortunately this didn’t work…
the console displayed:

“Uncaught Error: Invalid GeoJSON object. mapbox.js:3
s.extend.geometryToLayer mapbox.js:3
s.GeoJSON.s.FeatureGroup.extend.addData mapbox.js:3
s.GeoJSON.s.FeatureGroup.extend.initialize mapbox.js:3
e mapbox.js:1
s.geoJson mapbox.js:3
(anonymous function) index.html:36″

I thought..”
maybe I can’t style within loadURL… maybe I have to use l.geojson
and call it again?””

=======
Then, I was still confused and as I was continuing to find examples of what I was looking for and eventually asked Bill Morris, a longtime leaflet/mapbox.js/tilemill user.

He showed me several maps he recently made of Burlington
where he styled styled polygons in leaflet based on the properties of the geojson file but.

So, in this commit and
(as html),

I used 2 functions to style the polygons but no styling was happening. Still stumped.
I wanted to make sure that my 2nd function (to determines which color is being used in the style based on the property of parking) was being called/run. so I first used the show method inside the getColor function.

There was no error in the javascript console or information to find out why the functions were being called, I thought.

I tried again with replacing show with console.log and same result: the polygons would display , but
I couldn’t figure out why my getColor function wasn’t calling the property in my geojson file.

Throughout the day, I found a couple more examples (from maptime and mapbox’s store locator – that were similar to what I was looking for – customizing a feature based on the feature’s properties
(for reference, a feature is a geographic object that represents a point or a polygon) – but neither were for customizing polygons, but they offered a couple ideas of other things I tried, with no success..

I had wondered if should I first use the loadurl method and then use the filter option/method to not loading any styling; then use another function to add the data again and style it?”

Then <a href="http://twitter.com/geografa"Rafa Gutierrez from MapBox helped me out, and gave me an example of applying a style to all polygons in a geojson file (code).

Thanks to Rafa’s example and the reading documents for the upteenth time, reading the
I finally figured out a couple REALLY IMPORTANT concepts and learned where I went wrong:

I was using ‘style’ as a method in my previous commits. Again, THIS IS WRONG!
Only looking after his example,

style is not a method, but an OPTION in leaflet.

L.mapbox.featureLayer() is based upon and ‘extends’ the l.featureGroup. You can use a few more methods that are listed in L.mapbox.featureLayer() as well as all of the methods that are in l.featureGroup with l.mapbox.featureLayer.

I didn’t immediately realize that I could use the setStyle method to style my polygon since my object (which I named ‘featLayer’ in all of my examples) was constructed from l.mapbox.featureLayer because all of the examples I had found online (at the time) had constructed their object using l.geojson and used the style option of l.geojson.

But, now how do I style based on the properties of the feature in the geojson file, I wondered!
Part 2 of how I learned this, coming up.

Defining a neighborhood’s identity in cleveland – rough draft

(this is a rough draft)

Defining neighborhoods and discussion of Cleveland’s neighborhood names and boundaries has a discussion on urbanohio.com led me to and gather up some of my thoughts and observations from the recent years.

(from
[quote author=8ShadesofGray link=topic=2492.msg712498#msg712498 date=1403364432]
Time will tell whether the name Hingetown will stick Not the case in Ohio City, but I’d argue at this point, Gordon Square probably has a stronger brand than Detroit Shoreway and Asiatown a much stronger brand than the city’s official designations of the area as Goodrich-Kirtland or Payne-Sterling.

(context: Hingetown, a name for a neighborhood based on West 29th and Church Ave, where Rising Star Coffee is located).

As for Hingetown, I’m not a fan of the name itself (aesthetically, like ‘hingetown?’) but understand its functionality and Graham’s motivation for it. North of Lutheran Hospital unfortunately still has a stigma (I am not saying that it is justified) of being unsafe. Instead of strongly tying in with Ohio City, he decided to create a new name (to fight the stigma) and perhaps he thought it was OC was too geographically large and it needed a sub neighborhood (I could agree with the latter point).

A single business owner creating the neighborhood’s name isn’t the healthiest to do (did he consult any other local stakeholders? the residents, other businesses in the area?) I’ve seen the name used so far by Ohio City’s twitter and coolcleveland: that’s about it. The fact that it is very uniquely positioned: right across from the DS Bridge and leading to downtown is really the only unique characteristic that I see it distinct from the rest of Ohio City.

With regards to defining neighborhoods; geographical features are certainly an influence but it is not the only one. (They also act as borders; for example, the wide cliff between Brooklyn Centre and Old Brooklyn). Housing stock/age, businesses, other establishments that are unique to an area are also key influences. Most importantly, the residents of these neighborhoods – what should be the largest influence to determine a neighborhood’s name, aren’t using the names or self-identify as residents of that neighborhood.

Definitely agree with you on that point. City of cleveland planning officially has ‘statistical planning areas’ (36!) that are described by the city to be functionally equivalent ‘neighborhoods’.

In the case of the City of Cleveland, their influence of defining neighborhoods is minimal.

In several cases (corlett, jefferson, goodrich-kirtland, Euclid-Green), the names appear in only city planning documents.

Others (fairfax, Cuddell) have more use and identity as a neighborhood: they’re used by the CDCs and in the names of parks/Rec Centers/Public Libraries, maybe a local business or 2. (The level that they’re used by local businesses, stakeholders, and residents vary).

Then, I’d argue there’s a 3rd tier, others on that list (mount pleasant, hough, ohio city, old brooklyn, west park, tremont, collinwood) are extremely popular, used in the name of local businesses or stakeholders (churches, local non-profits), have numerous signage in the area that identify the neighborhood, and residents identify as being from there.

How I measured Cleveland’s road length (with postgis and OSM)

A couple weeks ago, I had been interested to know how how many miles of roads there are in Cleveland with all of the complaining that people have about the amount of potholes there are in Cleveland and because, well, I was curious.
By roads, I am referring to roads that are publicly accessible to vehicles.

I have been an active contributor to OpenStreetMap (OSM), a global geographic data that anyone can edit (think the wikipedia of google maps) in the Cleveland area, so Cleveland’s data was very current: I had the updated all of the changes the InnerBelt and other semi-permanent road closures in Cleveland, and a few new streets and re-openings (the roundabout in the flats for example, West 3rd Bridge). It is likely the most current database of Cleveland roads that exists, even compared to the county’s own database.

The following will guide how to do the same analysis for your city. Note, some cities may not be as current as Cleveland is in OSM.
(This assumes you know how to use postgis and osm2pgsql, and are able to create a osm2pgsql database that only contains your city. To learn how to create a postgis database of OSM data only containing your city via osm2gpsql, read this tutorial that I wrote: https://www.openstreetmap.org/user/skorasaurus/diary/15250

This tutorial is also ideal for people who are learning how to do some basic queries in postgis/postgresql from OSM data as I explain what columns and functions I use.

So, once you created your database of your city:

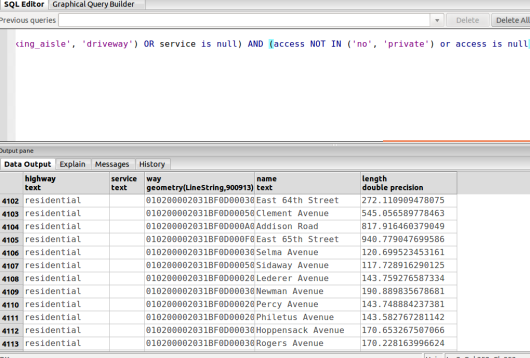
First, I crafted this query after a lot of trial and error to ensure that I was selecting all of the roads in Cleveland:

select highway, name, way, st_length(st_transform(way,3637)) AS length FROM planet_osm_line WHERE highway NOT IN ('construction', 'footway', 'path', 'steps', 'track', 'cycleway', 'pedestrian', 'abandoned', 'disused') AND (service NOT IN ('parking_aisle', 'driveway') OR service is null) AND (access NOT IN ('no', 'private') or access is null)

HOORAH!

So, what does this SQL all mean?

select highway, name, way, st_length(st_transform(way,3637)) AS length FROM planet_osm_line

I selected the highway and name columns. These columns are created in osm2pgsql, filled with values of each node/line in OSM (In OSM, objects are represented with tags, which is written out as “key=value”) for example, the street that the Simpsons live on could have the tags: highway=residential and name=Evergreen Terrace)

planet_osm_line is the name of the table (generated by osm2pgsql) that contains all of this data. The ‘way’ column contains the geography (the coordinates of where these lines are located). This ‘way’ column is generated by osm2pgsql.

You can use this query to browse some different streets in your city and make sure that all of the streets that you wish to include are listed..

Selection_046
Don’t worry if you see a street listed twice, it’s not that it was included one too many times, but a road that a single, straight way in real life may consist of 2 or 3 connected highways each with the same name in OSM, depending on a variety of factors (For example, part of the road may be on a bus route, part of the road may be one-way)

st_length measures the geometry that is inside the parentheses. What does it measure in centimeters? nautical miles? The units it measures is based on the coordinate system that is inside it (in our case, meters). At first, I just tried st_length(way) but I was using a test/sample road near where I grew up to ensure my results would be correct). With st_length(way), I was receiving 862 meters… not good.
I had measured my test/sample road in google maps and in Josm, using its measurement plugin.. My test/sample road was 646 meters with josm’s measurement plugin.

my test/sample road query:

select highway, service, way, st_length(st_transform(way,3637)) AS length FROM planet_osm_line WHERE name in ('Name of the street Ave');

Back to the st_length… I realized that’s because st_length was using the projection that osm2pgsql had my database in, 900913 (this is set by default).. So, I had to change the geometry to another projection system. ..I found that I could do this by using st_transform – http://postgis.org/docs/ST_Transform.html , and inputting the column with the geometry and the coordinate system.
I knew that Northern Ohio was 3637 (EPSG), so I decided to transform to that http://spatialreference.org/ref/epsg/3637/ …. and I was right on the money! 647.247 meters. A little more than 1 meter off on 600 meters.. I’ll take that margin of error :)

WHERE highway NOT IN ('construction', 'footway', 'path', 'steps', 'track', 'cycleway', 'pedestrian', 'abandoned', 'disused')

This selects all lines that have the “highway” key are not tagged as highway=construction, footway, path, track, cycleway, pedestrian, abandoned, or disused. Steps, dirt paths, sidewalks (known as footways in OSM lingo), cycleway (Dedicated bike paths), and other very specific tags are not included in my query and I was not trying to measure these.

As mentioned earlier, I just wanted to measure ways that were open to the public, ones that people would drive on, that are publically maintained.

AND (service NOT IN ('parking_aisle', 'driveway') OR service is null) AND (access NOT IN ('no', 'private') or access is null)
I didn’t want to include ways that were driveways (which are tagged as service=driveway) or the roads withing parking lots (known as service=parking_aisle in OSM). In most instances, a highway will not have a service tag, so I also included or service is null. I also didn’t want roads that were not accessible to the public (roads inside of inside industrial plants in Cleveland’s industrial valley).

So… My selection of roads is what I want, so I now had taken the task of how to add them all up together…

Now to find the length of these:

I didn’t know the proper syntax for sum, so I tried a couple things like:
select highway, service, way, st_length(st_transform(way,3637)) AS length, sum(length) FROM planet_osm_line

and

select highway, service, way, sum(st_length(st_transform(way,3637)))
– received message in pgadmin that “column “planet_osm_line.highway” must appear in the GROUP BY clause or be used in an aggregate function LINE 1: select highway, service, way, sum(st_length(st_transform(way…
^

After reading about aggregate functions, I learned that I couldn’t include highway, service, and way in the first part of the query,
and I realized, I didn’t need to at this point; I just wanted the sum.

select sum(st_length(st_transform(way,3637))) from planet_osm_line where highway NOT IN ('construction', 'footway', 'path', 'steps', 'track') AND (service NOT IN ('parking_aisle', 'driveway') OR service is null) AND (access NOT IN ('no', 'private') or access is null)

And this query worked! It gives the sum, 2,361,057 meters which is 1467.09 miles.

But if you want to break it down by what kinds of roads there are, you need to use a group by.

select highway, sum(st_length(st_transform(way,3637))) from planet_osm_line where highway NOT IN (‘construction’, ‘footway’, ‘path’, ‘steps’, ‘track’, ‘cycleway’, ‘pedestrian’, ‘abandoned’, ‘disused’) AND (service NOT IN (‘parking_aisle’, ‘driveway’) OR service is null) AND (access NOT IN (‘no’, ‘private’) or access is null) group by highway

I’m grouping by the highway column, which is the from the highway tag in osm.

highway | sum
—————-+——————
unclassified | 91555.5506847939
primary | 79289.4305883909
secondary | 108610.45598608
motorway | 148936.906333119
tertiary | 190819.531876563
tertiary_link | 1749.67663661471
motorway_link | 104634.677558715
secondary_link | 2884.04084138583
primary_link | 372.479453999729
service | 140106.53820064
residential | 1480741.60563354
(11 rows)

(in metric):

Or in other terms:

Freeways: 92.54 miles
Freeway on/off ramps: 65.01
service roads (alleys): 87 miles
residential streets: 920 miles
main arteries (example: Chester, Lorain, East 55th, Pearl), all of these roads in Cleveland are 3+ lanes): 238.43
unclassified (two lane roads with no/few houses on them): 57 miles

Results and caveats:
I was bit surprised that freeway on/off ramps were that long.
Roads that have a physical separation between them (Chester, Euclid) are counted twice, because they are classified as two separate roads in the OSM database.
These results include roads within cemeteries! I’m working to update my results so they are not included.

Anthony Bennett’s historically poor start

(I normally don’t write about sports on here, but I watch it from a distance and have as little emotional investment.

I have given up on Anthony Bennett.

Giving up on Anthony Bennett’s potential within 3 months of the season seems premature but no respectable* player in NBA’s modern era (86-87 to present, that’s all I can find stats for) has started out as poorly or had as long of a sustained stretch of mediocrity as Anthony Bennett has had.

Quantifying someone’s contribution to an nba game is subjective, but one stat that is out there is a someone’s game score. I know it’s not perfect because it doesn’t highlight the contributions of defensive-minded players like bruce bowen, kurt thomas, Ben wallace, etc. But it’s used quite often and represents how a player contributes to a game.
(here’s the formula for it: http://www.basketball-reference.com/about/glossary.html search for GmSc)

Let’s take a look at Anthony Bennett so far this year.
http://www.basketball-reference.com/players/b/bennean01/gamelog/2014/

He has only had 1 game with a game score above 5 (dec. 31, 2013, vs. pacers) http://www.basketball-reference.com/boxscores/201312310IND.html and in all but 2 these 27 games, he’s played more than 5 minutes.
Anthony Bennett has had streaks of 15 and 10 consecutive games with this mediocre performance of game score less than 5.

So, here’s a list of players who have had the most consecutive games of a game score below 5 and have at least played 5 minutes in a game… The players that Bennett has had company with:

1988-89 through the 93-94 seasons

94-95 through 99-2000

00-01 through 04-05

04-05 through 08-09
http://www.basketball-reference.com/play-index/pstreak.cgi?request=1&player_id=&year_min=2005&year_max=2009&team_id=&opp_id=&is_playoffs=N&game_location=&is_starter=&c1stat=mp&c1comp=ge&c1val=5&c2stat=game_score&c2comp=le&c2val=5&c3stat=&c3comp=ge&c3val=&c4stat=&c4comp=ge&c4val=

08-09 through 13-14
http://www.basketball-reference.com/play-index/pstreak.cgi?request=1&player_id=&year_min=2010&year_max=2014&team_id=&opp_id=&is_playoffs=N&game_location=&is_starter=&c1stat=mp&c1comp=ge&c1val=5&c2stat=game_score&c2comp=le&c2val=5&c3stat=&c3comp=ge&c3val=&c4stat=&c4comp=ge&c4val=

Heck, if we remove the 5 minute requirement, Bennett’s streak was at 24 games!

Here are those lists for consecutive game scores less than 5, regardless of minutes played.
08-09 through 13-14:

(Look whose name are on there! Former Cavs Sasha Pavlovic and Diop; fellow recent lottery draft busts Jan Vesely and Austin Rivers…) Not far down is another bust, Austin Rivers…)

02-03 to 07-08:


96-97 to 01-02

90-91 TO 95-96 http://www.basketball-reference.com/play-index/pstreak.cgi?request=1&player_id=&year_min=1991&year_max=1996&team_id=&opp_id=&is_playoffs=N&game_location=&is_starter=&c1stat=&c1comp=lt&c1val=&c2stat=game_score&c2comp=le&c2val=5&c3stat=&c3comp=ge&c3val=&c4stat=&c4comp=ge&c4val=

Out of these lists of hundreds of players who have played as lousy for such a sustained stretch, does anyone respectable appear? Do you even recognize any of those names?! (Yes I do, and that’s not a compliment to me..)
Would you want any of those players on your team or heck, even as a starter who would also receive minutes in crunch time and the fourth quarter?

What respectable players share these honors with AB? Mike Bibby, Ben Wallace (who, I’d argue, was the best defensive player in the 2000s, is an anomaly since his strength was so much on defense and took very few shots, leading to a low game score), Lou Williams, Rashard Lewis, Andrew Bynum, and Elden Campbell, are some notable names out of the hundreds who appeared on those lists. There’s a few more (Shawn Kemp) whose names appear AFTER they hit their prime and were then scrubby role players.

What lottery picks are on this list? Anyone who was deserved to be taken as a #1 pick?!

Fact is, only a very small percentage of players who were at least as good as a respectable starter have ever played that poorly over such a sustained stretch at any point in their career.

Despite such a small sample size, AB has already committed such a sustained stretch of mediocrity that very few NBA players have experienced regardless of the success of their career.

His probability to be a future star or even a viable starter or key rotation player in the NBA is dwindling by the day.

Follow along as I create a map of where I’ve been in 2013

(Follow along in my process of creating a simple heat map – from initial idea, to brainstorming, trial and error, coding, designing, and more trial and error in between)

Before I start:
goal: create a heat map that displays all of my traces of where I was in 2013.

what’s the map’s purpose: – create something purdy and find out where I have been the most in 2013.

Context: In 2013, I had taken 140 gps traces* using osmtracker, my favorite gps logging software, on the android. Nearly all traceswere taken while I was driving or riding my bicyle.
(This does not include traces that I had taken in Haiti in May-June while with the Humanitarian OpenStreetMap Team.

Here’s some brainstorming:
– what tool to use? Most of my projects and cartographic exploration have been with Tilemill.
In this case, using tilemill isn’t a smart move here, because I had hundreds of layers that i’d have to manually add.

I thought of manually combining all of the traces together – which I did using this simple bash script and a
gpx file manipulator called gpsbabel:

gpsbabel -i gpx $(echo $* | for GPX; do echo " -f $GPX "; done) \
-o gpx -F appended.gpx

I added the merged gpx file as a new layer to a tilemill project and received an error:
“This datasource has multiple layers:
‘waypoints’,’routes’,’tracks’,’route_points’,’track_points’
(pass layer= to the Advanced input to pick one)”

Instead of looking for a workaround for the error, I thought about, hey, let’s give cartodb a shot!
I have been looking for an excuse to use cartoDB for ages. I had played around with it minimally over the past year and a half, but my comfortability with Tilemill and the fact that I simply had not had a project where I thought it would be a
really appropriate tool for the job, hadn’t come up.

Let’s give cartodb a shot now…
uh-oh :( )
appended.gpx is too large (it’s 5.6mb). You can import files up to 4.53 MB.

Perhaps I should simplify the GPX traces I thought? I also thought, let’s just convert it to geoJSON and see if geoJSON would resize it’s size… so using ogr, I thought to do:

ogr2ogr -f "GeoJSON" traces.json appended.gpx
ERROR 6: "GeoJSON driver doesn't support creating more than one layer"
ERROR 1: Terminating translation prematurely after failed
translation of layer routes (use -skipfailures to skip errors)

What?! I thought “what do you mean by multiple layers?”
– Does ‘layers’ in the error message mean geometry types (points, linestrings) ? or multiple geometry collections? Some extensive google searching just led to the gdal source code which didn’t give me any more clues..

I walked away for an hour or 2, then thought something might have been wrong in my gpx file.
I opened the gpx file in qgis, and saw, hey it asked me which layer to open of the file and it referred to:

Selection_004

The layers created from my GPX file consisted of 5 layers, including points where I made voice recordings, text notes, or had taken a picture. The layer that I want – the linestrings that I recorded, ended up being the Tracks layer. (The other layers: routes was blank; track_points were the points that make up my linestring; waypoints were points where I had taken a voice recording, text notes, or a picture)

My traces and points in qgis
Selection_024

So, I thought I could just specify the layer within my geojson with the following
ogr2ogr -clipsrclayer tracks -f “GeoJSON” tracksonly.json appended.gpx

I thought this would select the layer that I’m exporting to, but it does not.

Alas, that didn’t work, I received an error as mentioned earlier in the post.

So, fellow readers:

Any suggestions for tools to use or workflow for this?

(Updates to this post will be made as I progress along)

What I plan to do :

– Some more google and gis.stackexchange searching for some inspiration.
– save the gpx file (selecting only the tracks layer) as JSON in qgis and open in
cartodb and/or Tilemill.


I also wonder:
Simply convert each of them individually to geojson files, and then add all of them as a layer in a leaflet instance?

Update 1, 2014/01/02, 7pm:
– I converted the tracks layer in my gpx file to JSON (only 1.3mb!) and created a cartodb project for it . Success!
– I’ve also created a tilemill project and loaded my JSON in there. (I’ll post links soon)

I thought of a new idea: increasing or changing a section of the line based on its proximity to another line…
For example, if there’s another line within 60 meters of it at a specific point, increase the intensity of color of the line for a few meters…

This cannot be done out of the box in tilemill or cartodb… but I have a hunch that this sort of calculation could be done in postgis… I would then reimport this data into cartodb and style there.

HMM, this also looks interesting – http://developers.cartodb.com/tutorials/intensity_map.html

Some thoughts on NACIS, 2013.

I went to NACIS, the annual conference for north american cartographic information society.
This was my 2nd NACIS, my first was 2012 in portland.

This experience was much more positive and enriching for a few reasons, mostly personal:

Looking back, I was intimidated last year. At the time, I was unemployed, struggling freelancer at my first cartography conference and what was my third professional conference. There were many of my mapping heroes there, all of whom, I hadn’t met before. Since last year, I’ve learned a lot more and felt more comfortable of what was being discussed. I recall last year there were a couple talks where I felt completely lost in what was being presented (bivariate maps, for example). No instances of that this year :)
The crowd was a bit younger – meaning there were people in similar situations as myself or similar aged. Last year, I felt pretty young, outside of the college students.
Additionally, there were several people from the twitter and web sphere that I recognized (many more from last year), or had met online, or knew of their work – and had the chance to see them in person or catch up with them (Alan M, andy woodward, mele, mike foster, aj, ian, and dane from mapbox, matt mckenna, mamata akella).
All friendly people. I even drank and played pool with them. Interestingly, those who tweeted more often also tended to be more extroverted.
Plus, it helps when your local mentor also attends the conference this year:)

Presentations were more relevant to my background: I wanted to see practical things that I could implement in my work (of web maps), see things that push the boundaries of what a typical map is – particularly on the web, and what can be mapped in new ways (to wide audiences) and how. I’m not generally a theory person. My entire experience with using ESRI products is about 30 minutes. Last year, there was much more of an academic slant with a focus on theoretical talk and things on historical mapping.
This year, I’m really glad that I shelled out the extra $90 or 100 for Practical Cartography Day. It was quite practical – almost all on web maps of some sort and was in fact likely the best day of the conference. Even serendipitous conversations became really relevant: a discussion over lunch evolved to neighborhood boundaries (one theoretical topic that I find really intriguing) was great.

– Even outside of PCD, this year had much more focus on web maps and using open-source tools that I’ve been quite comfortable with or am anxious to use:
Tilemill, leaflet, D3, qgis. Someone (I forget who) mentioned that, this year, established, older cartographers are finally accepting that the internet (specific through web maps not just a static image) is the primary medium for contemporary cartography and it’s here to stay, and/or they’re even beginning to use some of these tools.

– Wednesday night featured a map gallery, 30-50 printed maps done by students, professionals, and anyone in between, on display. While it was great to see, I would love to see the map gallery to include online web maps, even if there’s dozens of computers set up to see them.

– My only other criticism: presenters, although it’s not the same as attending the talks, slides can be at least of some use and helpful to those who didn’t attend. Share them ! You just need to add a link to your talk on lanyard!
http://lanyrd.com/2013/nacis/schedule/

– I presented on the Humanitarian and lower income countries’ web map , designed by the Humanitarian OpenStreetMap Team (Presentation available at: http://skorasaurus.github.io/hotatnacis2013/. It went well although it was very difficult to see the contrasting colors on the projected screen; you couldn’t tell whether a road was yellow or beige, or see a streets outline very well.

In retrospect, I should have tried a dry run with the projector and maybe I could have made simple modifications (like dimming the lights). More interestingly, I felt like that I belonged more since I presented or at least that I had something to offer this time. Last year was definitely a feeling of imposters’ syndrome. Discussing someone’s presentation is also a great conversation starter.

– Despite that at least 15% of talks were rescheduled or cancelled, the organizers did a great job of making things run smoothly as possible. Without the last second adjustments, this could have been a trainwreck.

Notable absences: – Code for America had a much smaller presence than last year although that could be because its annual conference was the following week. Additionally, CfA could have had less map-related projects this year. – The Feds. :( Several presenters were employees of the US government and as a result, couldn’t present because of the shutdown. laaame! Missed out on a few talks as a result (3 of the 4 in the same session as my presentation were cancelled!) Kudos to those who filled in at the last minute.

– An interesting point Eric Thiesse, Matt Mckenna, and I discussed at the Friday banquet dinner, the last night of the conference: We all do web mapping, marvelling how there’s so much change in the geospatial world even as we are trying to keep abreast of new technologies, tools, mapping libraries: How do you keep up and sharp on them ? Then I remembered what Tom McWright once tweeted months ago regarding this: you don’t. I’ve had this in the back of my mind since then. It’s impossible to keep up. You pick your battles. Now that my time to work on geospatial projects and mapping is greatly reduced (Thanks day job!). I’m picking my battles, being a little more discerning on what to learn or what projects to spend time on. Slowly coming to terms that I will fall behind on some things.